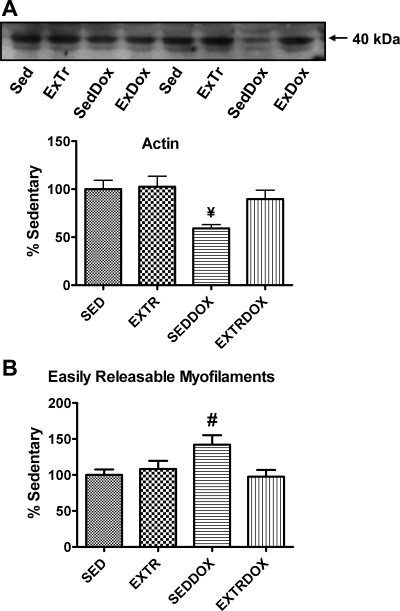
Fig. 6.
Protein abundance of actin (A) and easily releasable myofilaments (B) as indicators of soleus muscle proteolysis. Representative Western blots for actin are shown above graph. Values (means ± SE) represent percent change. #Significantly lower than ExTr. #Significantly higher than ExTr and ExTrDox.

