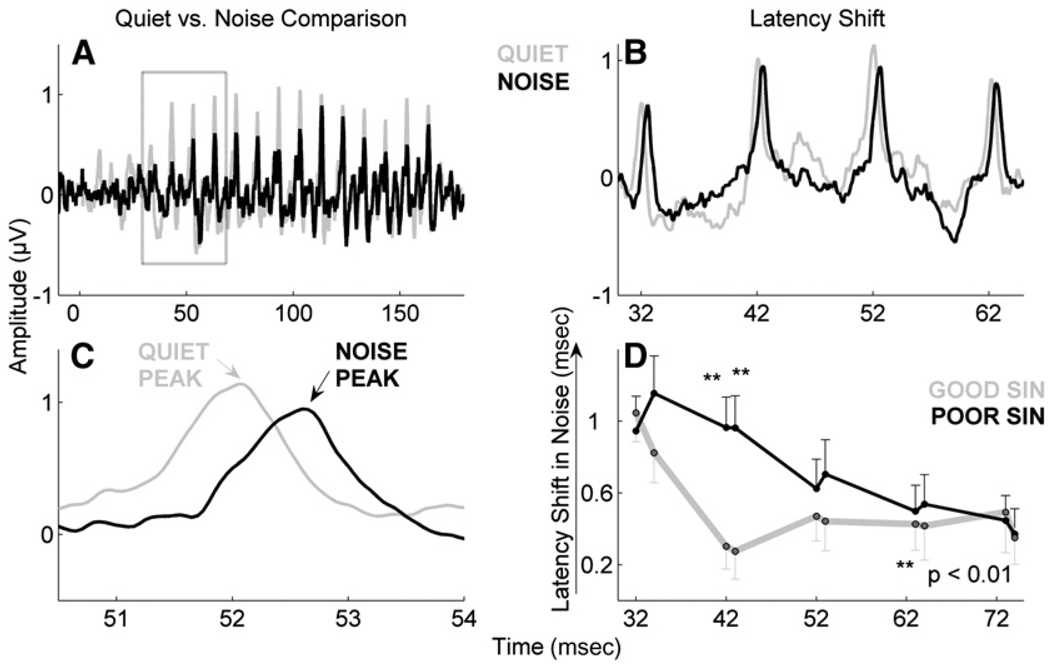
Figure 4.
Effects of noise on brainstem responses in children with good and poor SIN perception. The effects are most evident in the transition region (A, boxed) of the response from 30 to 60 ms in the grand average waveforms of 66 children (B and C). Greater noise-induced latency shifts were noted in the children with poor SIN perception compared to children with good SIN perception (p < 0.01) (D). Adapted from Anderson et al, 2010.

