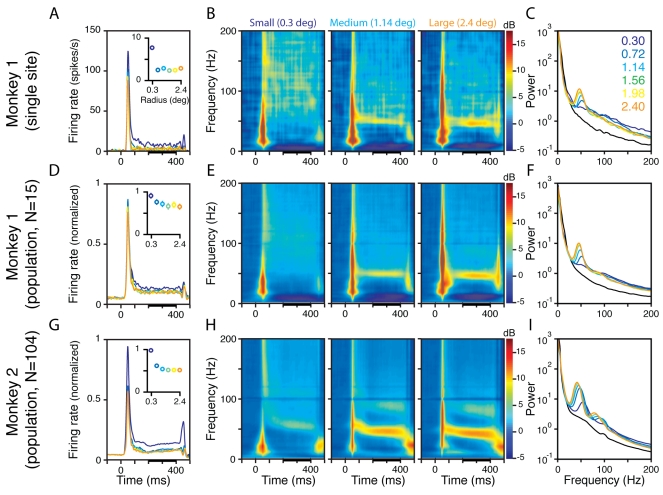
Figure 1. Dissociation of the gamma rhythm and high-gamma activity by manipulating stimulus size.
(A) Average multiunit recorded from a single site in Monkey 1 during the presentation of a static grating (0 to 400 ms) at six different sizes, shown in different colors. The inset shows the average firing rate between 200 and 400 ms, indicated by a thick black line on the abscissa. (B) Time-frequency energy difference plots (in dB) showing the difference in energy from baseline energy (−300 to 0 ms, 0 denotes the stimulus onset, difference computed separately for each frequency) for the smallest (radius of 0.3°, left panel), medium (1.14°, middle), and largest (2.4°, right) sizes. The gamma rhythm at ∼50 Hz increases with size, while the high-gamma activity above the gamma band decreases with size. (C) The LFP energy between 200 and 400 ms (denoted by a thick black line on the abscissa in B) as a function of frequency for the six sizes, whose radii are listed in the legend. The black line shows the LFP energy in the baseline period. (D–F) and (G–I) show corresponding population responses of 15 and 104 sites from Monkeys 1 and 2, respectively. For (D) and (G), the responses are normalized by dividing by the maximum firing rate for each site. Monkey 2 showed two distinct gamma bands at ∼50 and ∼90 Hz.

