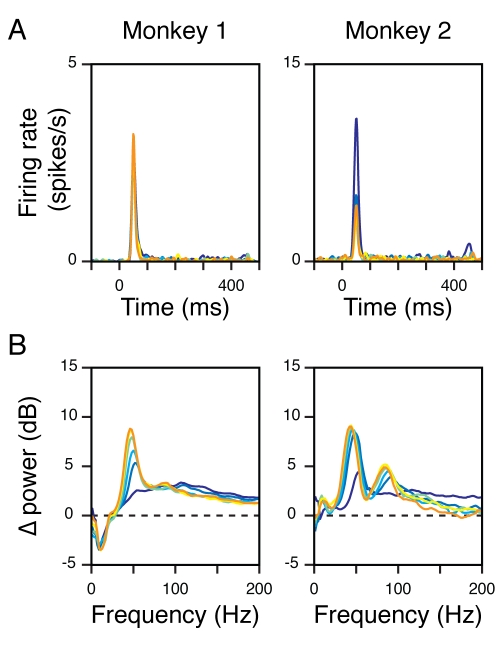
Figure 3. Changes in power with stimulus size are observed even when firing rates are negligible.
(A) Average firing rate of 30 and 10 sites in Monkeys 1 (left column) and 2 (right column), for which less than 0.5 spikes/s were obtained between 200 and 400 ms. (B) Difference in power between 200 and 400 ms from baseline power (same format as Figure 2A) for these sites.

