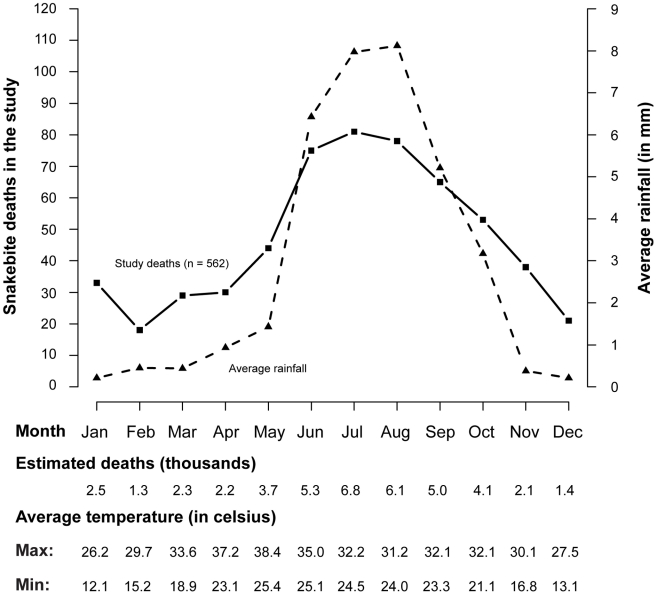
Figure 2. Seasonality pattern of snakebite mortality and rainfall in states with high prevalence of snakebite deaths (2001–03).
Rainfall amount (mm) is cumulative daily rainfall for the past 24 hours measured by the India Meteorological Department [22], [23]. Maximum and minimum temperatures are also measured daily and presented as monthly averages across the 13 snakebite high prevalence states. Pearson correlation coefficients between snakebite mortality and weather were: (i) rainfall; 0.93 (p<0.0001); (ii) minimum temperature: 0.80 (p = 0.0017); (iii) maximum temperature: 0.35 (p = 0.2585).

