
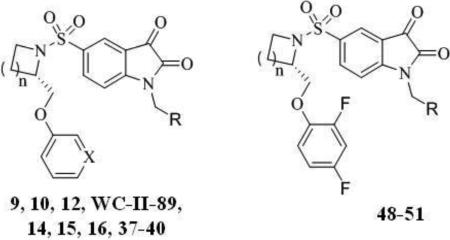
Table 3.
Inhibition activities for caspase-3 in HeLa cells.
 | ||||
|---|---|---|---|---|
| Compd. | n | X | R | EC50 (μM)a |
| 9 | 1 | CH |
|
2.00±0.44 |
| 10 | 1 | CH |
|
2.15±0.45 |
| WC-II-89 b | 2 | CH |
|
4.50±1.10 |
| 14 | 2 | CH |
|
1.69±0.18 |
| 15 | 2 | CH |
|
1.30±0.25 |
| 12 | 1 | N |
|
0.38±0.07 |
| 16 | 2 | N |
|
0.39±0.09 |
| 37 | 1 | CH |

|
0.80±0.06 |
| 38 | 1 | N |
|
0.42±0.10 |
| 39 | 2 | CH |

|
0.93±0.21 |
| 40 | 2 | N |

|
0.35±0.04 |
| Compd. | n | R | EC50 (μM)a | |
| 48 | 1 |
|
1.39±0.40 | |
| 49 | 2 |
|
2.50±0.80 | |
| 50 | 1 |

|
1.06±0.20 | |
| 51 | 2 |
|
0.68±0.39 | |
a
IC50 values are the mean ± SD of at least three independent assays
b
reference 14.