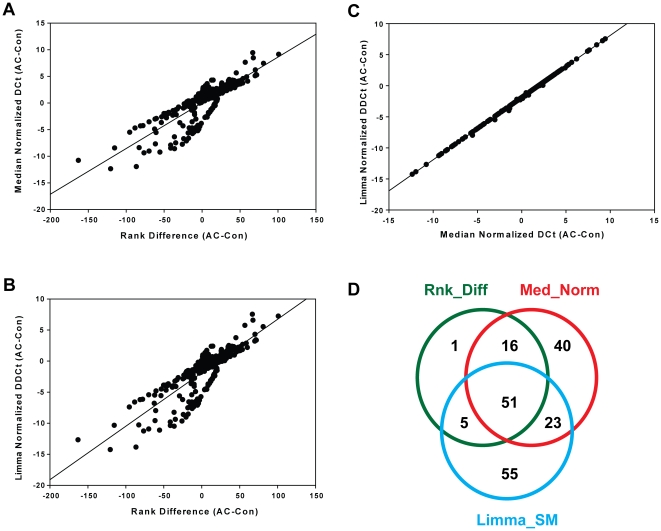
Figure 1. Comparison of three different normalization methods to identify differentially expressed miRNAs in DSS-induced acute colitis.
Changes in rank order, defined as mean rank in AC samples minus mean rank in Con samples, are plotted against DCt values (mean Ct_AC minus mean Ct_Con) in Panel A or DDCt (mean DCt_AC minus mean DCt_Con) in Panel B. Limma normalized DDCt values for individual miRNAs are plotted against median normalized DCt values in Panel C. Differentially expressed miRNAs were filtered on P<0.01 and rank order change ≥10 or log2 fold change ≥1.0. Overlap between differentially expressed miRNAs identified by rank order statistics (Rnk_Diff), t-test using median normalized data (Med_Norm), or the Statminer implementation of Limma (Limma_SM) is shown in Panel D.

