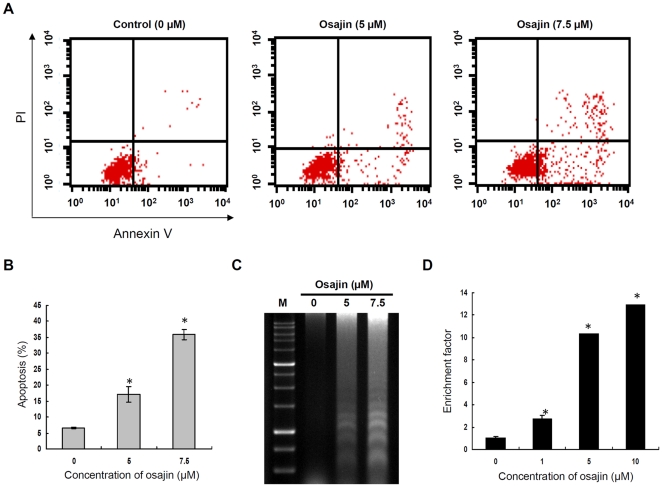
Figure 2. Osajin treatment induces apoptosis and DNA fragmentation in TW04 cells.
Cells were treated with 0, 5 or 7.5 µM osajin for 24 h and stained with Annexin V-FITC and PI. (A) Cells in the upper-right (UR) portion represent cells undergoing late apoptosis, whereas cells in the lower-left (LL) and lower-right (LR) portions are viable and early-apoptotic cells, respectively. (B) The data indicate the percentage of annexin V-positive cells (apoptosis). (C) Agarose gel electrophoresis of DNA fragments from cells treated with various concentrations of osajin for 24 h. M: 1 kb DNA ladder size marker. (D) Cells were treated with various concentrations of osajin for 24 h in a 96-well plate, and the enrichment of nucleosomes in the cytoplasm was determined using the Cell Death Detection ELISAPLUS kit. Results are shown as the means ± SE of four independent experiments (*P<0.05 versus 0 µM control).

