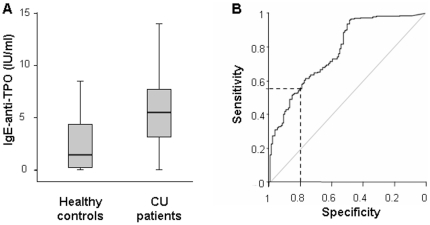
Figure 1. Patients with chronic spontaneous urticaria exhibit elevated levels of IgE-anti-TPO.
Fig. 1a Box-Plot: Healthy persons (n = 127) exhibit in the mean IgE-anti-TPO levels of 2.58 IU/ml±2.46, 1st quartile 0.27– median 1.46– 3rd quartile 4.45 (median 1.46, IQR 0.27–4.45 IU/ml). Highest value among the healthy persons was 7.8 IU/ml. CU patients (n = 478) show elevated mean levels of 5.69 IU/ml±3.17, 1st quartile 3.2– median 5.5– 3rd quartile 7.73, (median 5.50, IQR 3.2–7.7 IU/ml), highest value 18.0 IU/ml. The differences between the two groups are statistical significant (p<0.001). Figure 1b ROC-Curve: Diagnostic accuracy for the distinction of CU patients and healthy controls was analysed by ROC curve including selected pairs of sensitivity and specificity (Table 1), the area under the curve (AUROC = 0.78) and the confidence limits for this curve (CI = 0.74–0.83). The selected specificity of 0.8 and the resulting sensitivity of 0.55 are displayed as dotted line in the graph.

