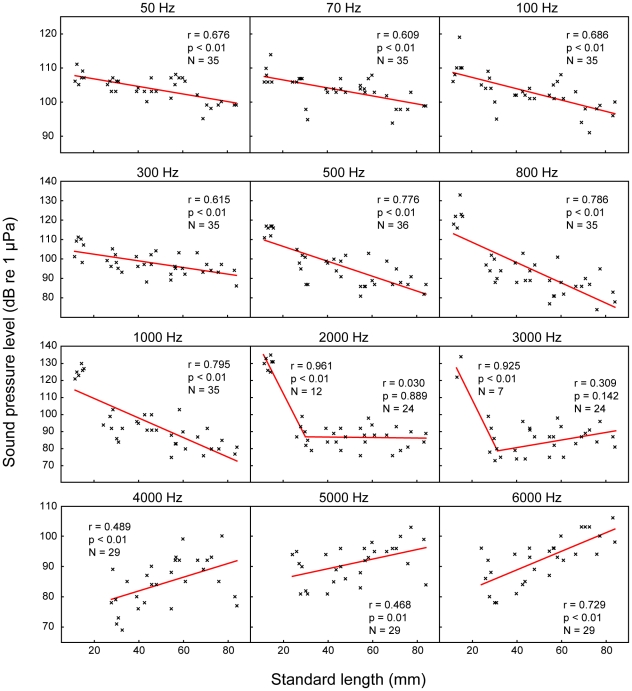
Figure 7. Correlations between auditory thresholds and fish size at each frequency tested.
Plots of hearing thresholds of each individual against standard-length at each frequency tested. N-values, Pearson's correlation coefficients and significances are given in graphs. Regression equations: x = standard length, y = hearing threshold (dB re 1 µPa); 50 Hz: y = −0.11 x+108.90; 70 Hz: y = −0.12 x+108.92; 100 Hz: y = −0.17 x+110.51; 300 Hz: y = −0.17 x+105.66; 500 Hz: y = −0.38 x+114.09; 800 Hz: y = −0.52 x+118.88; 1000 Hz: y = −0.57 x+120.92; 2000 Hz: breaking point (BP) = 30.18 mm, SL<BP: y = −2.62 x+164.96, SL>BP: y = 0.01 x+85.64; 3000 Hz: BP = 30.77 mm, SL<BP: y = −2.88 x+167.74, SL>BP: y = 0.15 x+76.68; 4000 Hz: y = 0.23 x+72.87; 5000 Hz: y = 0.16 x+83.01; 6000 Hz: y = 0.31 x+76.61. Regression lines in 2000 Hz and 3000 Hz were drawn according to the results of the segmented linear regression calculation. Note two p and r values (one for each regression) in graphs of 2000 Hz and 3000 Hz.

