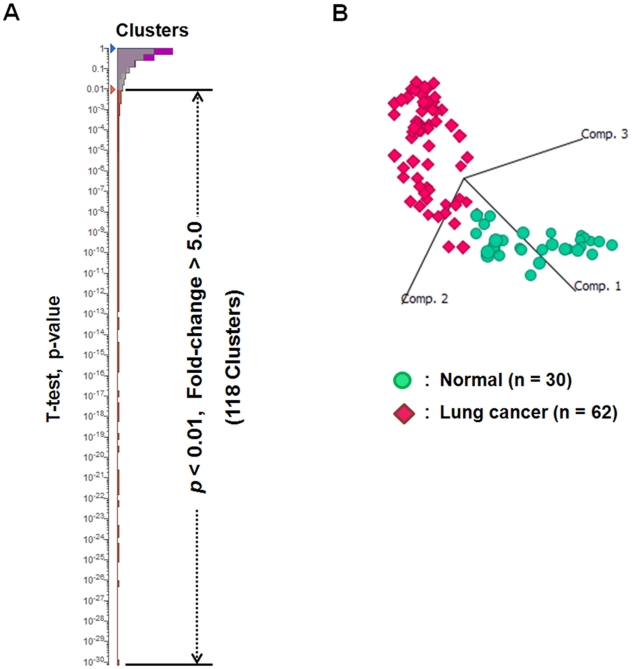
Figure 4. Statistical identification of candidate biomarkers for lung cancer.
(A) The hierarchy chart of clusters (peptides) according to Student's t-test p-values (normal group vs. lung cancer group). 118 peptides satisfied the criteria of p<0.01 and fold change >5.0. (B) Principal component analysis using the values of 118 candidate biomarker peptides showed clear separation between control and lung cancer groups on the 3D plot. The proportion of variance described by the principal component 1, 2, or 3 was 66.9%, 15.0%, or 4.4%, respectively.

