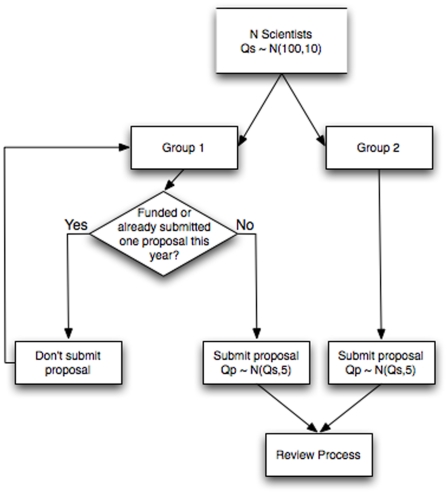
Figure 1. Proposal generation and submission process.
Proposal generation by N scientists, of quality Qs, drawn from a normal population of mean 100 and standard deviation 10. Proposals are of quality Qp, drawn from a normal population of mean Qs and standard deviation 5. Arrows indicate the flow of decisions through the proposal submission process.

