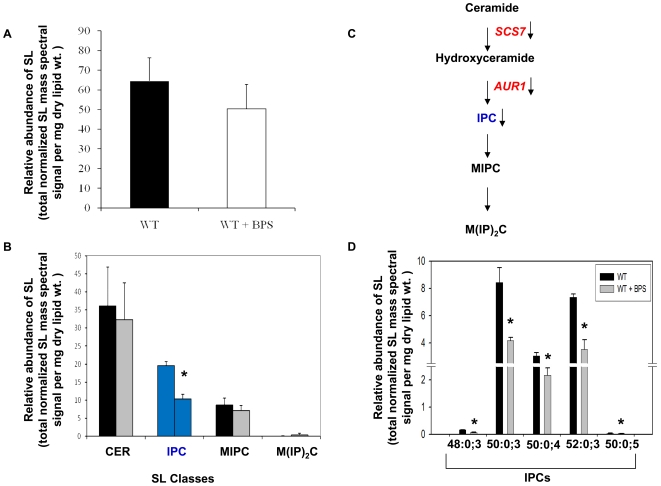
Figure 5. Sphingolipid Composition of Iron Deprived Cells.
A. The relative abundance of SLs (as total normalized SL mass spectral signal per mg dry lipid wt.) in Candida (WT) cells in absence and presence of BPS. B. The relative abundance of SL classes (as total normalized SL mass spectral signal per mg dry lipid wt.). The total for each SL group was calculated by adding the normalized mass spectral signal of molecular lipid species of that group. Error bars indicate ± SD. (n = 3, 3 independent analyses of lipid extracts from 3 independent cultures). C. Sphingolipid pathway showing the iron responsive genes in red and accumulated intermediate IPC in blue which matches with bars in Fig 5B. D. Molecular lipid species compositions of IPC (as as total normalized SL mass spectral signal per mg dry lipid wt.) in Candida (WT) cells in the absence and presence of BPS. Only the major molecular lipid species (P value<0.05) are depicted in this figure. Values are means ± SD (n = 3 and * depicts P value<0.05).

