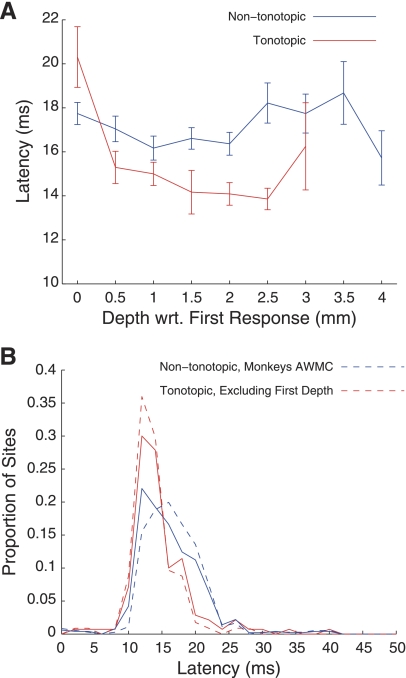
Fig. 10.
Latency distribution for tonotopic and nontonotopic penetrations. A: average latency at each depth, relative to the first auditory recording in the penetration, for tonotopic (red) and nontonotopic (blue) penetrations. Error bars indicate SE. Distributions of latency in tonotopic and nontonotopic penetrations (B) overlapped, although tonotopic penetrations generally showed more faster (i.e., lower latency) responses. The trend persisted when data from monkeys not showing tonotopy were excluded (blue broken line) or when the shallowest recordings were excluded (red broken line).

