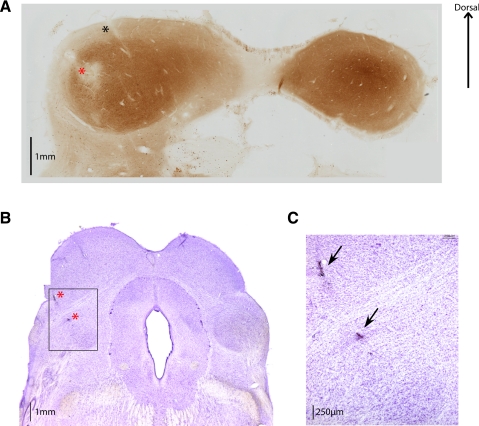
Fig. 11.
Histological verification of recording locations. A: 60-μm coronal section from monkey W stained with cytochrome oxidase. The location of an electrolytic lesion (noted on the map in Fig. 5) is indicated with a red asterisk. A track left behind by a recording electrode, ∼1 mm medial to the lesion and following the 30° angle established by the chamber, is indicated with a black asterisk. IC central nucleus (ICC) can be visualized as the region showing a dark stain, indicative of higher metabolic activity. A section from monkey X is shown in B, in which 2 lesions were made along a penetration through the central region of recordings (the location is noted on the map in Fig. 5, and on the image with red asterisks). Sections from this monkey were 50 μm thick and stained with cresyl violet. Section containing the lesion is rostral to the one shown in A, and the SC is clearly identifiable on the dorsal part of the slide. Just deeper than the lesion the rostral pole can be found, indicating that this penetration was just anterior to the ICC. C: magnified view of the square in B. Image shown in B and C has been published previously (Porter et al. 2006).

