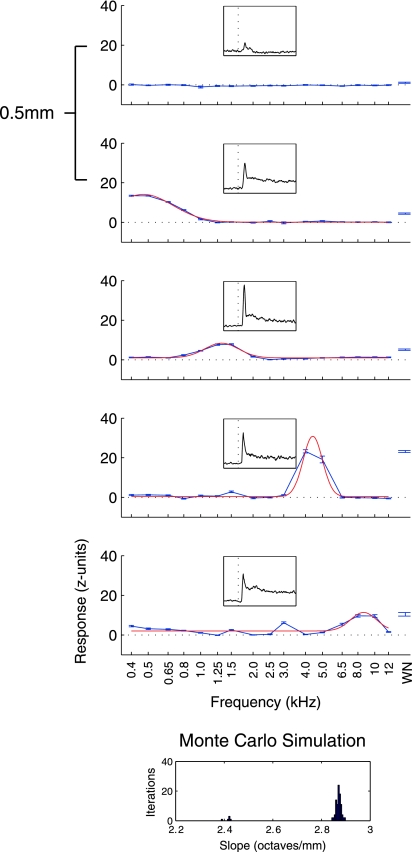
Fig. 3.
Frequency responses from a tonotopic penetration. Plotted in the same format as Fig. 2; the panels show an increase in BF with deeper recordings. All iterations of the Monte Carlo analysis used to detect tonotopy showed positive slopes. (note the different scale on the x-axis as compared with Fig. 2).

