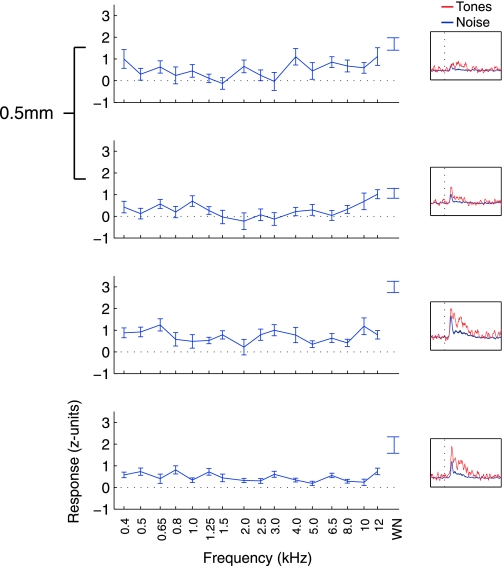
Fig. 4.
Frequency responses from an untuned penetration. Plotted in the same format as Fig. 2; this penetration showed no clear tuning. Gaussian curves did not fit the data and so are not plotted. Sites in this penetration responded to tones but did not prefer a group of tone frequencies over others. Here, the PSTH insets show firing rate changes over time separately for noise (red trace) and tone (blue trace) trials. No inset is shown for the Monte Carlo analysis used to detect tonotopy, as this analysis could not be run on untuned penetrations.

