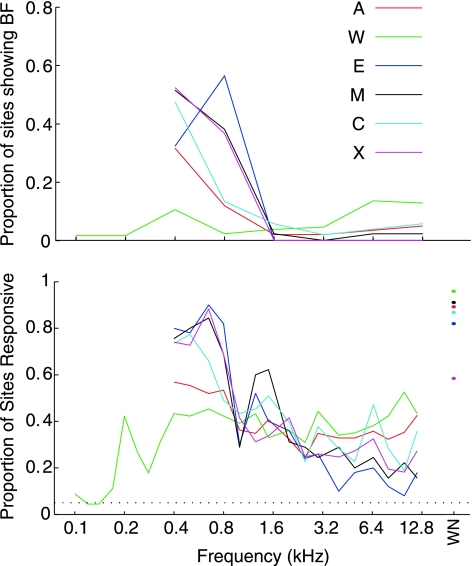
Fig. 6.
Bias of tuning toward low frequencies throughout recordings. Top: distribution of BF values determined by Gaussian fits to the isointensity frequency response data collected. Lines show the proportion of auditory sites that showed a BF in logarithmically spaced windows. Bottom: proportion of neurons responding to each tested frequency. Both representations of the data indicate a heavy bias toward low frequency selectivity, although B establishes that virtually all of the tested frequencies elicited responses at some sites.

