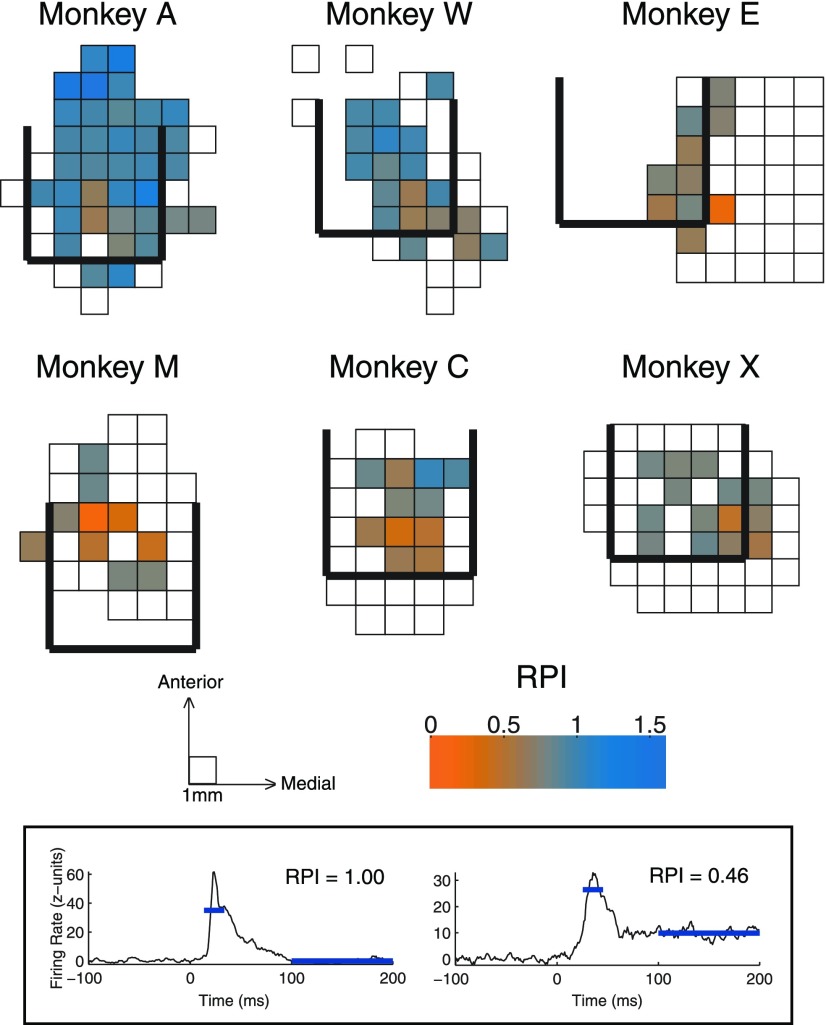
Fig. 7.
Maps of temporal profile of response in the horizontal plane. Maps follow the format in Fig. 5, here color indicates the average response profile index (RPI) from each penetration location. Lower values of RPI indicate more sustained responses. Inset: time periods used to calculate RPI with the data from two example recordings.

