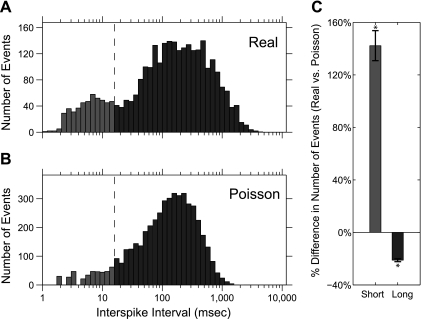
Fig. 2.
Real and Poisson (simulated) ISI histograms. A: ISI histogram of a real spike train (cell c117 from Fig. 1A). Dotted line indicates the static division between the short- and long-ISI categories at 15 ms. B: ISI histogram of the simulated spike train obtained from the rate-coded Poisson model of the same neuron. Total number of simulated spikes matches that of the real spike train. C: relative numbers of short and long ISI events in real vs. Poisson-simulated spike trains across the population of neurons. Positive values indicate that there are more of those events in the real spike train. Standard error bars are shown.

