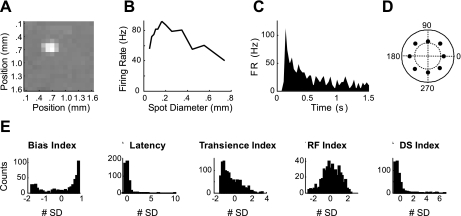
Fig. 2.
Parameter calculation and distributions. A: spike-triggered average is shown to demonstrate how the center of each cell's receptive field was determined and is defined by the center of mass of all pixels exceeding 3 SD of the mean. B: peak-firing rate is plotted vs. the presented spot size. From this plot, a Receptive-Field (RF) Index was measured that estimated the strength of each cell's surround. C: poststimulus time histogram for the stimulus producing the largest response in B; this was used to calculate the Latency and Transience Index of the response of each cell. D: a polar plot of the sum of spikes produced for each direction of motion of a moving bar. Units are average spike count during the presentation of the stimulus. Inner dotted circle represents 25 spikes, and outer solid line represents 50 spikes. Magnitude of the vector average of the response was taken as the Direction Selective (DS) Index. E: histograms of the different parameters used, plotted as the means ± SD.

