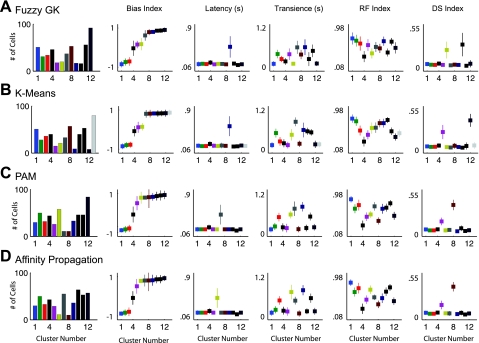
Fig. 4.
Comparison of results from each clustering algorithm. Best results of the different clustering routines (A–D) are compared by examining the relative values of cluster centers for each parameter (columns 2–6). Column 1: histograms of the number of cells making up each cluster. Columns 2–6: for the results of each clustering algorithm, the median values ± SD of the different clusters are plotted for each parameter, respectively. In A–D, the clusters are organized and color coded in ascending order according to their ON vs. OFF index value from minimum to maximum. A: 12 cluster solution of the Fuzzy-GK algorithm. B: 13 cluster solution of the K-Means algorithm. C: 12 cluster solution of the PAM algorithm. D: results of the AP algorithm at 12 clusters.

