Fig. 1.
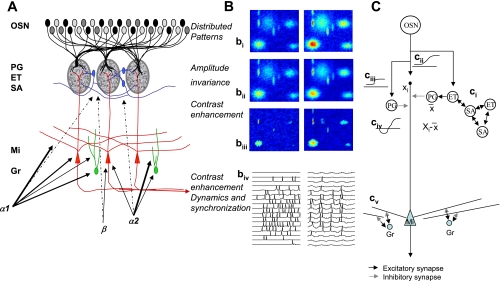
Olfactory bulb processing. A: schematic of olfactory bulb organization. Olfactory sensory neurons (OSN) expressing a common receptor, and therefore exhibiting similar odorant receptive fields, project to 2 common glomeruli in the main olfactory bulb (MOB). Within this glomerulus, OSNs make excitatory synapses onto mitral and tufted cells and the primary output neurons of the MOB, as well as glomerular layer interneurons comprising periglomerular (PG) and external tufted (ET) cells. Most PG cells (∼70%) and a third type of interneuron, short axon cells (SA), are not directly activated by OSNs. PG, ET, and SA cells form intricate networks within the glomerular layer that have been proposed to perform operations such as normalization, contrast enhancement, and synchronization. In deeper processing layers, mitral cells (Mi) interact with at least 1 other class of interneurons, granule cells (Gr). These provide extensive feedback and lateral interactions between Mi cells by interacting with their elongated secondary dendrites. This layer of processing is thought to be involved in creating olfactory bulb gamma rhythms and generating synchronized spike patterns. Noradrenergic inputs from the locus coeruleus activate 3 classes of noradrenergic receptors distributed across the MOB. α1-Receptors are thought to be predominantly located on Mi and Gr cell bodies, as well as secondary dendrites, with a sparser distribution in the glomerular layers; α2-receptors are mainly located on granule cells with a sparse distribution on Mi cell bodies and the glomerular layer; and β-receptors have been reported on Mi cell bodies and in the glomerular layer. B: schematic of glomerular input layer and Mi cell activity patterns in response to odor stimulation. bi-–biii show simulated distributed odor responses at 2 concentrations, with the lower concentration at left and high concentration at right. The 2-dimensional simulations are color coded, with red indicating high, and dark blue low, levels of activity. bii shows the same patterns after amplitude invariance processing has been performed by the network of local interneurons, and biii shows the same pattern after contrast enhancement. The patterns in biii represent the end result of the glomerular computations transmitted to deeper layers by Mi cells. The details of these computations are given by Cleland et al. (2007) and Cleland and Sethupathy (2006). biv shows how spikes generated in Mi cells in response to activation patterns (left) are transformed into sparser, oscillatory and highly synchronized spike patterns (right) by the interactions with deeper interneuron networks (Escanilla et al. 2010; Mandairon et al. 2006b). C: neural networks that could perform bulbar computations. ci indicates amplitude invariance computation as proposed by Cleland et al. (2007). ET cells sample OSN activity across the glomerular layer. A localized network of SA and ET cells, densely interconnected, calculates the sum or average activity amplitude (X̄) across the glomerular layer and projects this average activity onto inhibitory PG cells. PG cells inhibit Mi cells, hence Mi cells, which sample a single data point Xi from OSN, inputs process Xi − X̄, corresponding to a z-score normalization. cii–civ: local contrast enhancement as proposed by Cleland and Sethupathy (2006). OSN odor responses (cii), schematically drawn as response amplitude as a function of receptor-odorant affinity, activate Mi cells and PG cells. Because of the higher input resistance of PG cells, the corresponding response curves are steeper and more easily saturated (ciii). Because PG cells locally inhibit Mi cells, the resulting net effect on Mi cells is a Mexican hat function (civ). Contrast enhancement and amplitude invariance calculations are performed simultaneously and partially by the same neurons; the result is an activity pattern with higher contrast and relative amplitude invariance, as depicted in bi–biii. This activity is transformed again in deeper layers by dynamic interactions with Gr cells. Current thinking assumes that in this layer, activity patterns conveyed as Poisson-distributed spike trains (biv, left) are modulated and a fast oscillation in the gamma range is superposed on these spike trains, modulating them in time and creating periodically synchronized patterns as depicted schematically in biv (right). cv: interactions between Mi cell secondary dendrites and Gr cells provide feedback (within the same column) and lateral (between columns) inhibitory interactions. These have been proposed to create oscillatory dynamics, synchronization, and/or contrast enhancement.

