Fig. 7.
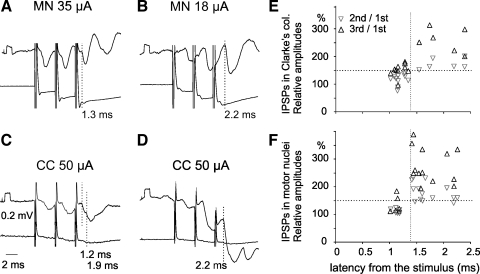
Comparison of latencies and amplitudes of IPSPs evoked in Clarke's column DSCT neurons from hindlimb motor nuclei and in motoneurons from the Clarke's column. A and B: records of IPSPs from 2 CC DSCT neurons (upper traces) and from cord dorsum (lower traces) evoked by stimuli applied within gastrocnemius-soleus and biceps-semitendinosus motor nuclei (at depths 2.8 mm and 3.4 mm, respectively). C and D: records of IPSPs evoked in anterior biceps-semimembranosus (C) and posterior biceps-semitendinosus (D) motoneurons by stimulation of Clarke's column. Vertical dotted lines indicate onsets of early components of IPSPs in A (latency 1.3 ms), of early and later components in C (latency 1.2 and 1.9 ms), and of longer latency (2.1 ms) IPSPs in B and D. Note that amplitudes of IPSPs evoked at short latencies were similar after the 3 stimuli, whereas amplitudes of longer latency IPSPs increased considerably. E and F: plots of increases in peak amplitudes of IPSPs (ordinate) evoked in 17 CC DSCT neurons (E) and 20 motoneurons (F) as a function of their latencies (abscissa). Gray and black triangles indicate increases after the second and third stimuli, respectively. Note clustering of data points in the left bottom and right top quadrants separated by dotted lines and that temporal facilitation of IPSPs evoked at latencies ≤1.4 ms was weaker. Differences between mean values of facilitation of short- and long-latency IPSPs (to the left and right of the vertical dotted lines in E and F) were highly statistically significant (P < 0.001, Student's t-test). MN, motor nucleus. Shock artefacts are truncated.

