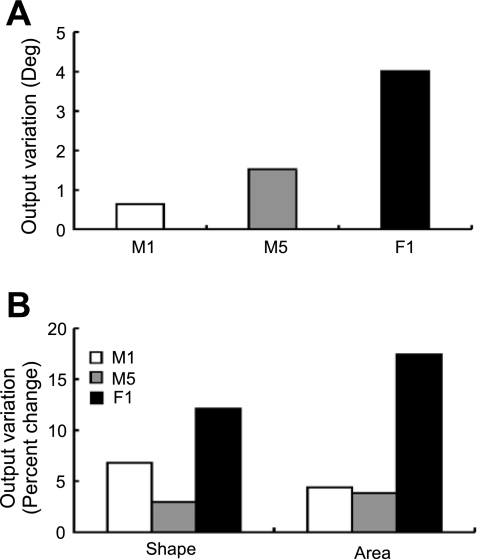
Fig. 4.
A and B: the comparison between the average total muscle volume of male subjects and the subject-specific total muscle volume of female and male subjects F1, M1, and M5. A indicates the variations of stiffness orientation in absolute units (degrees). B indicates the variations of stiffness shape and area normalized by their nominal values.

