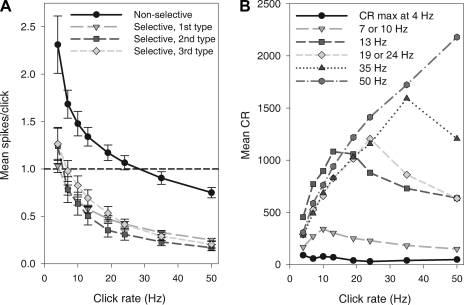
Fig. 4.
Characteristics of selectivity for click rate in the responses to 8 synthetic click rates (in ∼1,200-ms trains) presented to a group of 139 cells, 20 dB above threshold. A: cells grouped by visual inspection of raster-plot discharge patterns into 4 click-rate-selectivity types (symbols) all show a similar decrease in spikes per click averaged across 10 presentations. Error bars indicate standard error. B: cells are grouped according to the click rate that evoked the highest CR.

