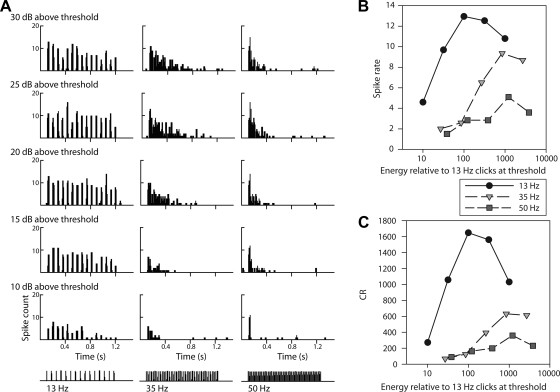
Fig. 5.
Rate selectivity persists across sound energy levels. Cell 69–18 was low pass for click rate as judged by A, the responses shown in poststimulus time histograms (PSTHs). B: spike rates of the same responses plotted against relative total stimulus energy. C: CR against stimulus energy. Three synthetic click rates shown at bottom of A (13, 35, and 50 Hz; columns in A and symbols in B and C) were presented 10 times at 5 different sound intensities (10, 15, 20, 25, and 30 dB above threshold; rows in A, converted to relative energy in B). Peak spike rates in B and CRs in C indicate a low-pass preference for rate (13 Hz), rather than a consistent low-pass preference for total energy (e.g., 100 times the 13-Hz train at threshold) regardless of click temporal pattern.

