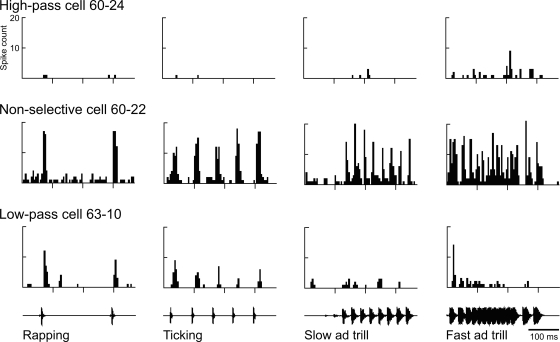
Fig. 6.
Call responses in a cell that was nonselective for click rate (60–22, middle), a rare cell high pass for click rate (60–24, top), and a low-pass cell (63–10, bottom). PSTHs show the responses of 3 cells (rows) to recorded natural call segments presented 10 times at 20 dB above threshold. The 370-ms call stimuli are shown below the histograms (the ticking is female; ad, male advertisement).

