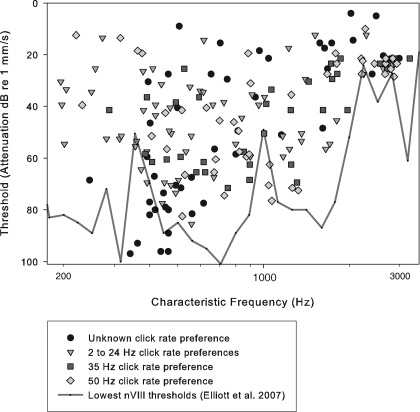
Fig. 7.
CF and thresholds from frequency-tuning curves in 191 TS cells. Minimum eighth nerve thresholds are overlain (black line) (Elliott et al. 2007). The categorization of cells based on click-rate selectivity is explained in the results from synthetic stimuli (see Figs. 3 and 4).

