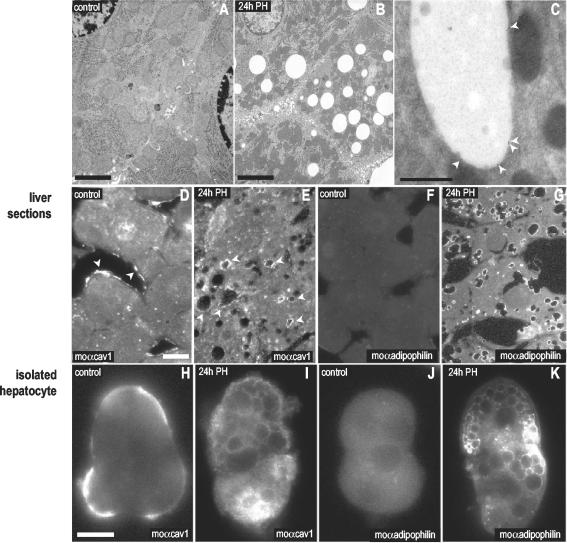
Figure 3.
Caveolin associates with LBs during rat liver regeneration. Microscopic characterization. Spur sections of control livers (A) and livers 24 h after PH (B). The accumulation of LBs in the cytosol of the hepatocytes can be observed. (D–G) Sections of control (D and F) and regenerating livers (E and G) were labeled with a mAb for caveolin-1 (moTL; D and E) and with a specific antibody to adipophilin (a marker of LBs; F and G). After 24 h of PH caveolin relocated from the sinusoidal PM of the hepatocytes (arrows) to intracellular structures identified as LBs by the presence of adipophilin. This was confirmed by immunogold electron microscopy on frozen sections using the rbTL antibody (C). (H–K) Hepatocytes from control (H and J) or regenerating livers (I and K) were isolated and the distribution of caveolin analyzed with a mAb for caveolin-1 (moTL; H and I) and for adipophilin (J and K). As in liver sections, 24 h after a PH caveolin-1 was detected decorating the surface of intracellular LBs. Bars, (A and B) 2 μm; (D) 200 nm; (E–L) 5 μm.

