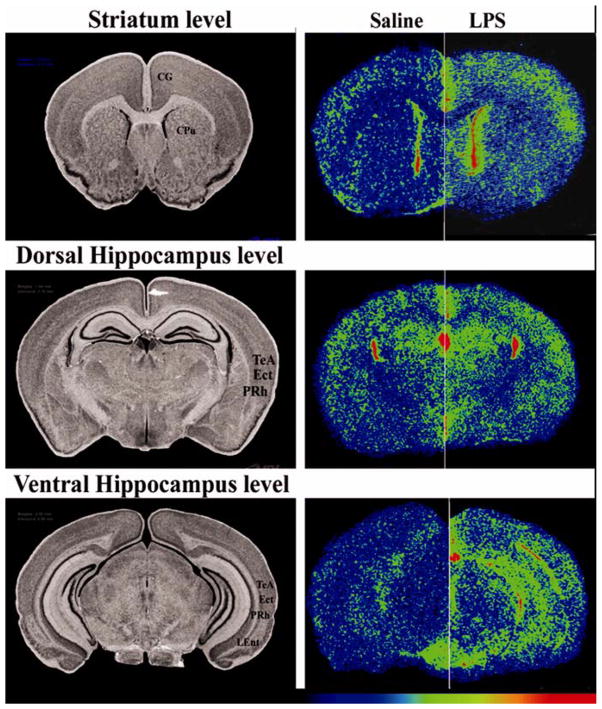
Figure 3. Effect of intracisternal LPS on the regional density of [3H]PK11195 binding.
A. Left column=anatomy(histology), right column=autoradiography. The autoradiograms in the right column compare hemispheres from 2 different animals. The hemispheres on the left are from brains of saline treated animals and the ones on the right form LPS treated mice. Autoradiograms were pseudo-colored using the rainbow spectrum, with the lowest levels in purple and highest levels in red. Images show total binding. Non-specific binding (not shown) was low and homogenous throughout gray matter regions.
CG = cingulate cortex; CPu = caudate-putamen (striatum); TeA = temporal association cortex; Ect = ectorhinal cortex; PRH = perirhinal cortex; LEnt = lateral entorhinal cortex

