
Figure 1. Variations in the ADH1B proximal promoter region.
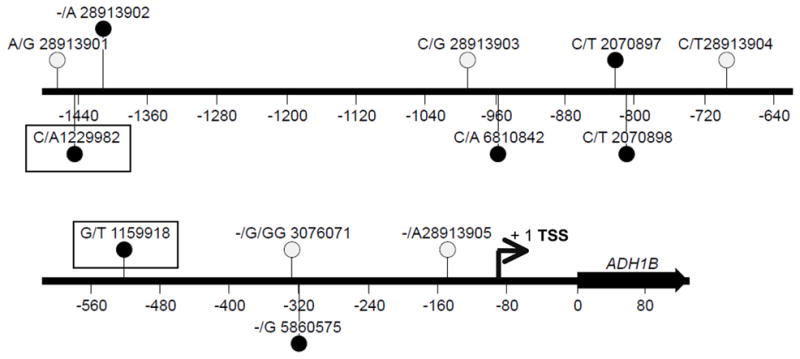
Twelve variations in the proximal promoter are shown as vertical lines with the SNP ID (rs number) and the two alleles to the left of the rs number. Filled circles represent those variations that were tested in the transfection assays. Variations associated with the risk for alcoholism are outlined by rectangular boxes. For some variations (shown as open circles), the same allele was present in all the haplotypes tested. Numbering is relative to the ADH1B translational start site (+1). The transcriptional start site (TSS) is indicated by an arrow.