
Figure 3.
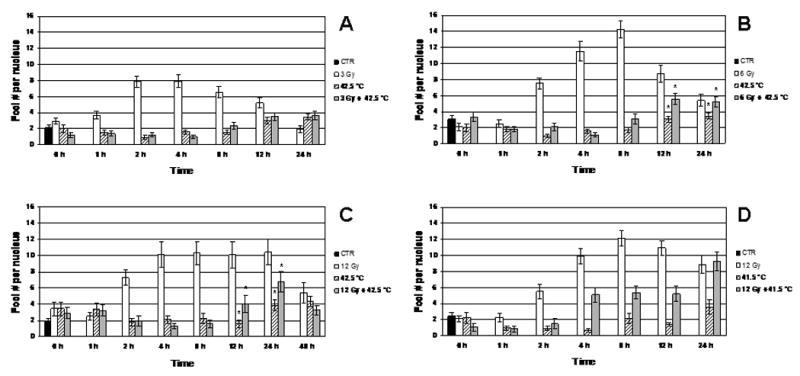
A: Dynamics of Mre11/Rad50 focus formation in the nuclei of unheated 3 Gy-irradiated, 42.5°C-heated unirradiated, and 42.5°C-heated 3 Gy-irradiated cells (four independent experiments). B: Dynamics of Mre11/Rad50 focus formation in the nuclei of unheated 6 Gy-irradiated, 42.5°C-heated unirradiated, and 42.5°C-heated 6 Gy-irradiated cells (four independent experiments). C: Dynamics of Mre11/Rad50 focus formation in the nuclei of unheated 12 Gy-irradiated, 42.5°C-heated unirradiated, and 42.5°C-heated 12 Gy-irradiated cells (three independent experiments). D: Dynamics of Mre11/Rad50 focus formation in the nuclei of unheated 12 Gy-irradiated, 41.5°C-heated unirradiated, and 41.5°C-heated 12 Gy-irradiated cells (three independent experiments). Vertical axis shows the average number of foci per nucleus (F). Horizontal axis shows the post-treatment time at 37° C, in hours. Note that at 0 h post-treatment, F values for heated, irradiated cells and for cells that were only irradiated or heated (A, B, C, D) insignificantly differ from F values for control cells (P > 0.05). Asterisks (*) show significant differences (P < 0.05) in F values between 42.5°C-heated unirradiated cells and 42.5°C-heated cells irradiated with 6 Gy or 12 Gy at 12 and 24 h post-treatment (B, C). Data presented are the mean ± standard error of the mean.