
Figure 4.
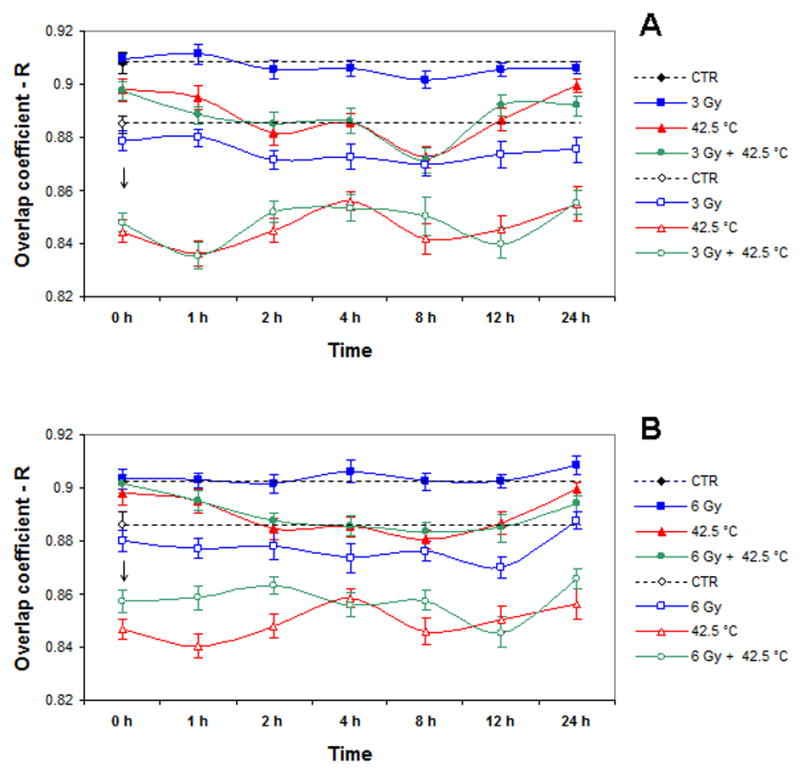
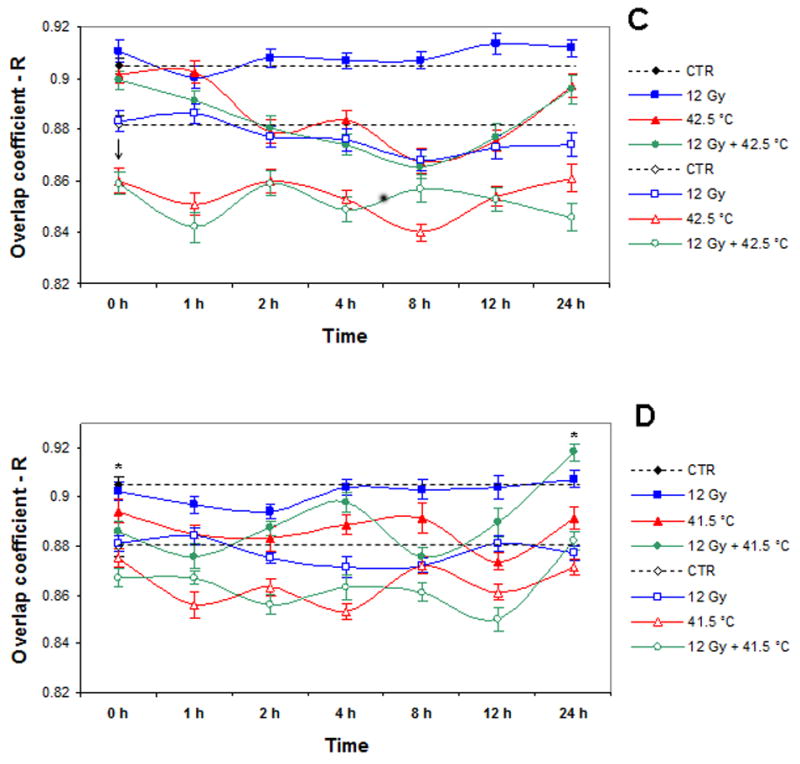
A: Dynamics of changes in Mre11/Rad50 or Nbs1/Rad50 co-localization in unheated 3 Gy-irradiated, 42.5°C-heated unirradiated, and 42.5°C-heated 3 Gy-irradiated cells (four independent experiments). B: Dynamics of changes in Mre11/Rad50 or Nbs1/Rad50 co-localization in unheated 6 Gy-irradiated, 42.5°C-heated unirradiated, and 42.5°C-heated 6 Gy-irradiated cells (four independent experiments). C: Dynamics of changes in Mre11/Rad50 or Nbs1/Rad50 co-localization in unheated 12 Gy-irradiated, 42.5°C-heated unirradiated, and 42.5°C-heated 12 Gy-irradiated cells (three independent experiments). D: Dynamics of changes in Mre11/Rad50 or Nbs1/Rad50 co-localization in unheated 12 Gy-irradiated, 41.5°C-heated unirradiated, and 41.5°C-heated 12 Gy-irradiated cells (three independent experiments). Closed symbols show the results for Mre11/Rad50 co-localization. Open symbols show the results for Nbs1/Rad50 co-localization. Vertical axis shows the overlap coefficient according to Manders (R). Horizontal axis shows the post-treatment time at 37° C, in hours. For Mre11/Rad50 co-localization, at 0 h post-treatment, except 41.5°C-heated 12 Gy-irradiated cells (D), all other variously treated cells (A, B, C, D) showed insignificant fluctuations in R values compared to R values of control cells (P > 0.05). For Nbs1/Rad50 co-localization, at 0 h post-treatment, except 41.5°C-heated unirradiated cells (D), all other variously treated cells (A, B, C, D) showed a significant drop in R values compared to R values exhibited by control cells (P < 0.05). Asterisks (*) show a significant difference (P < 0.05) in R values between control cells and 41.5°C-heated 12 Gy-irradiated cells at 24 h post-treatment (D). Data presented are the mean ± standard error of the mean.