
Figure 5.
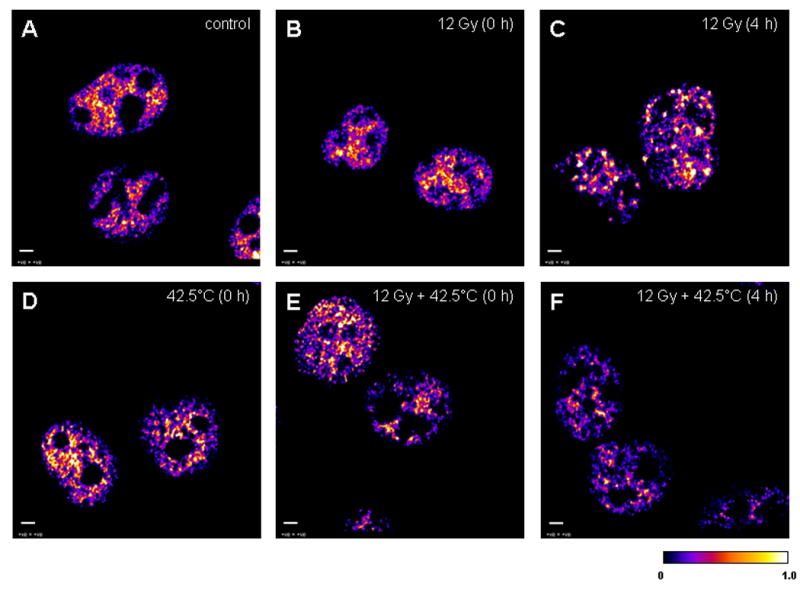
The 32-bit middle plane images of positive PDM values (that represent the best correlated pixels) derived from image correlation analysis between stained Mre11 (green) and Rad50 (red) in the nuclei of unheated unirradiated (control) cells and unheated 12 Gy-irradiated, 42.5°C-heated unirradiated, and 42.5°C-heated 12 Gy-irradiated at 0 and 4 h post-treatment. A: the nuclei of unheated unirradiated control cells (denoted as “control”). B: the nuclei of unheated 12 Gy-irradiated cells at 0 h post-irradiation (denoted as “12 Gy (0 h)”). C: the nuclei of unheated 12 Gy-irradiated cells at 4 h post-irradiation (denoted as “12 Gy (4 h)”). D: the nuclei of 42.5°C-heated unirradiated cells at 0 h post-treatment (denoted as “42.5°C (0 h)”). E: the nuclei of 42.5°C-heated 12 Gy-irradiated cells at 0 h post-treatment (denoted as “12 Gy + 42.5°C (0 h)”). F: the nuclei of 42.5°C-heated 12 Gy-irradiated cells at 4 h post-treatment (denoted as “12 Gy + 42.5°C (4 h)”). A similar pattern of Mre11/Rad50 co-localization in the nuclei of control (A) and unheated 12 Gy-irradiated cells at 0 h post-irradiation (B) was observed, probably because cells were kept on ice during irradiation. Calibration bar shows the quantitative distribution of co-localized proteins. Scale bars = 3 μm.