Figure 5.
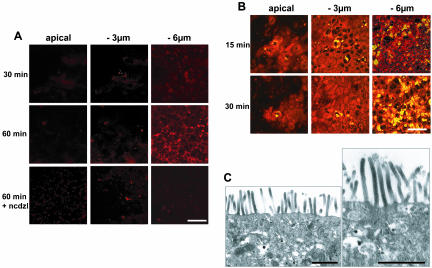
FA incorporation and TAG traffic after the apical application of micelles. Complex lipid micelles were applied apically to Caco-2 cells. (A) micelles contained Bodipy-labeled fatty acids. Bodipy-associated fluorescence was monitored at the apical plane and at 3 and 6 μm below this plane. Cells treated with nocodazole (ncdzl) during the period of incubation with micelles were analyzed after 60 min (bottom). Bar, 50 μm. (B) Accumulation of TAG as assessed by Nile-Red yellow fluorescence after the apical delivery of micelles (red color corresponds to phospholipids). Bar, 50 μm. Note that the kinetics of intracellular traffic were similar for FAs incorporated from micelles and Nile Red stained-TAG. (C) Transmission electron microscopy analysis of lipids localization in Caco-2 cells, 15 min after micelles application. Arrows indicate the presence of lipid droplets in the subapical compartment within the ER (stars). Note that the BBD is devoid of lipid droplets. Bars, 1 μm.

