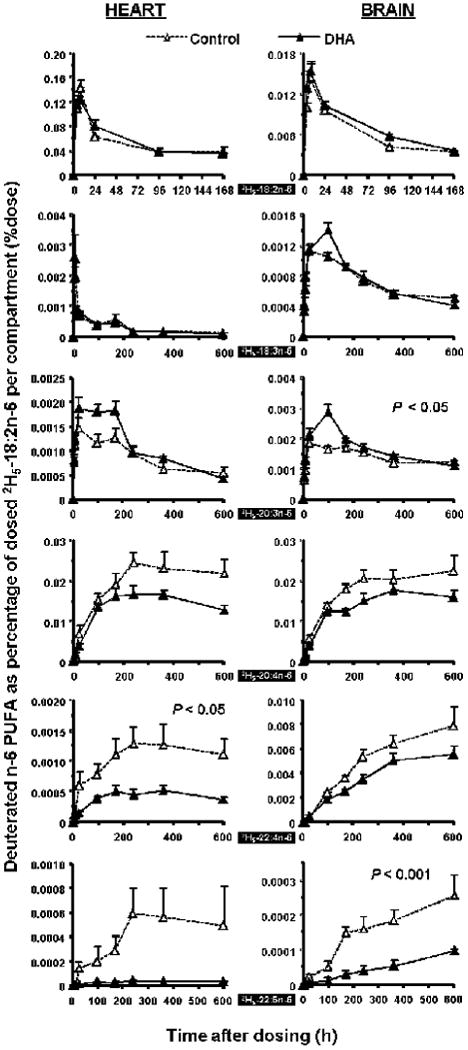
Figure 4.

Time-course curves of the labeled n-6 fatty acids in rat heart (L) and brain (R) after a single oral dosage of 2H5-18:2n-6. N/A indicates not available. See legend to Figure 1 for details.

Time-course curves of the labeled n-6 fatty acids in rat heart (L) and brain (R) after a single oral dosage of 2H5-18:2n-6. N/A indicates not available. See legend to Figure 1 for details.