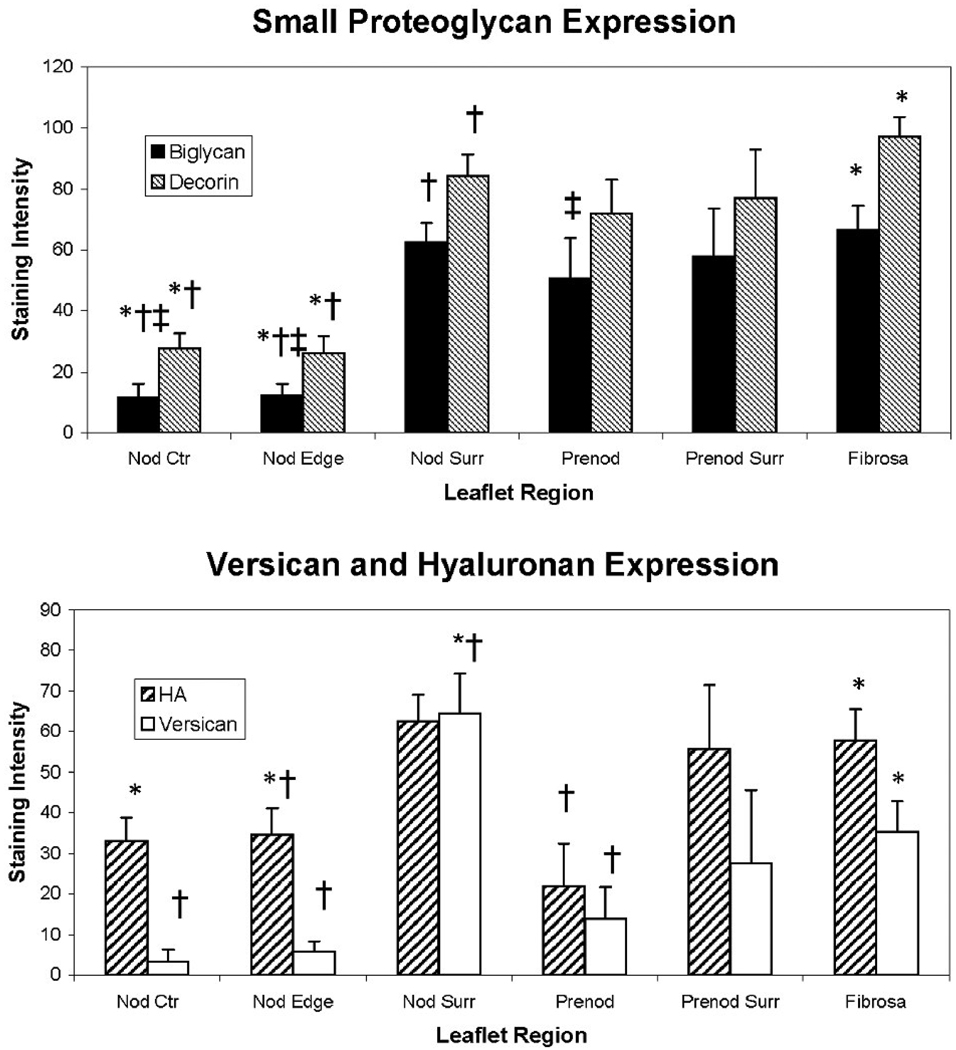
Figure 2.
Intensities of staining for PGs and HA in different regions of calcified aortic valves. Error bars indicate standard error of the mean. †p<0.05 compared to Nod Surr. *p<0.05 compared to Fibrosa. ‡p<0.05 compared to Prenod. Nod Ctr = innermost 2/3 of the large nodule. Nod Edge = outer 1/3 of the large nodule. Nod Surr = tissue immediately surrounding the large nodule. Prenod = prenodule. Prenod Surr = tissue immediately surrounding the prenodule.

