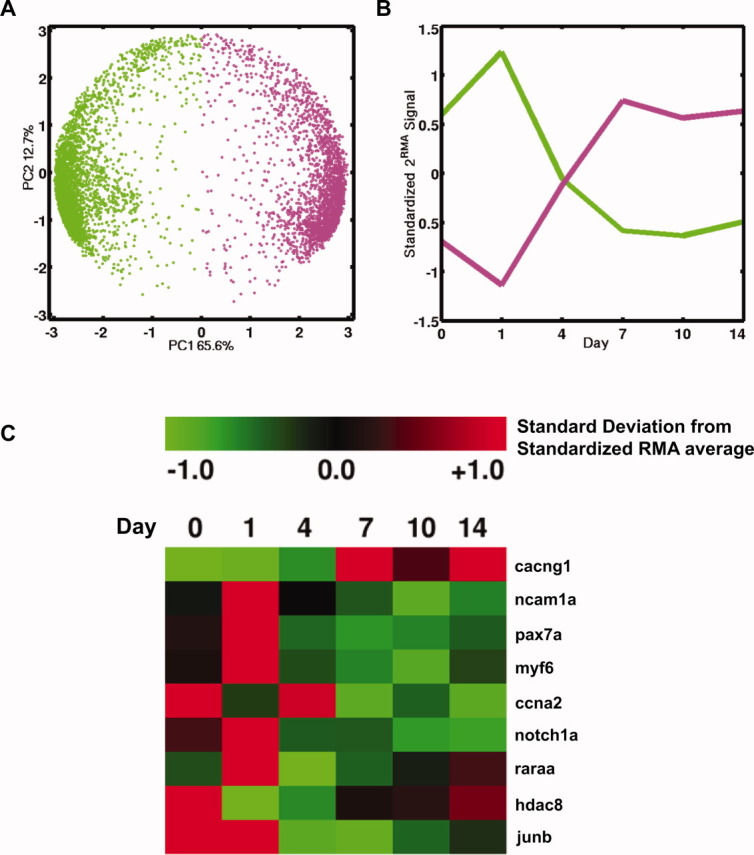
FIGURE 3.

Microarray analysis of zebrafish myogenic progenitor cell differentiation transcriptome. (A) Principal components analysis (PCA) showing the principal components 1 vs. 2 plot of the zebrafish muscle cell differentiation microarray data of 5960 reproducible genes (shown as colored dots) in time and indicates two large-scale temporal patterns of expression. Genes on the left hemisphere (green) are highly expressed at days 0–1, and decrease over time. Genes on the right hemisphere (magenta) show low expression at days 0–1, and increase over time. The principal components axes are a linear combination of the time-points. (B) The average expression profile of the genes from the two large-scale temporal patterns of expression. (C) Standardized expression for upregulation (red) vs. downregulation (green) of nine differentially regulated myogenic genes. [Color figure can be viewed in the online issue, which is available at wileyonlinelibrary.com.]
