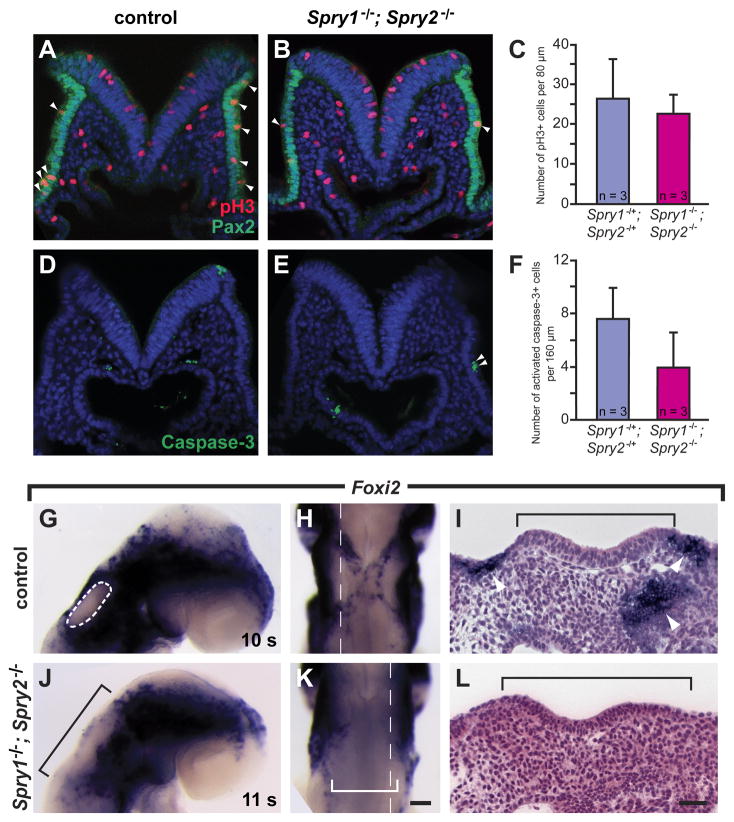
Figure 4. Foxi2 expression reveals a reduction in the size of the cranial epidermal domain in Spry1−/−; Spry2−/− mutants, in the absence of changes in cell proliferation and cell death.
(A, B) Transverse embryonic sections co-immunolabeled for pH3 (red) and PAX2 (green), counterstained with a nuclear dye (blue). (C) The average number of pH3+ cells within the PAX2 domain on both sides (left and right) of the embryo over a 80 μm distance from anterior to posterior. (D, E) Transverse embryonic sections immunolabeled for activated caspase-3 (green), counterstained with a nuclear dye (blue). (F) The average number of ectodermal, activated caspase-3+ cells over a 160 μm distance from anterior to posterior, encompassing the pre-otic field. (G – L) Foxi2 expression analyzed by in situ hybridization. (G, J) Lateral views of whole embryos, anterior to the right. The otic placode, which does not express Foxi2, is outlined in the control embryo (white dashed circle) and black bracketed in the Spry1−/−; Spry2−/− mutant. (H, K) Dorsal views of the same embryos shown in G, J, respectively. The white bracket indicates the region in the Spry1−/−; Spry2−/− mutant lacking Foxi2 expression. (I, L) Sagittal sections through the otic placode in the plane indicated by a white dashed line in H, K, respectively. The otic placode is indicated with a black bracket. Arrows point to patches of cells expressing Foxi2. Anterior is the left (I and L). Error bars (C, F) represent standard deviations. Scale bar, I, L, 50 μm; G, H, J, K, 100 μm.

