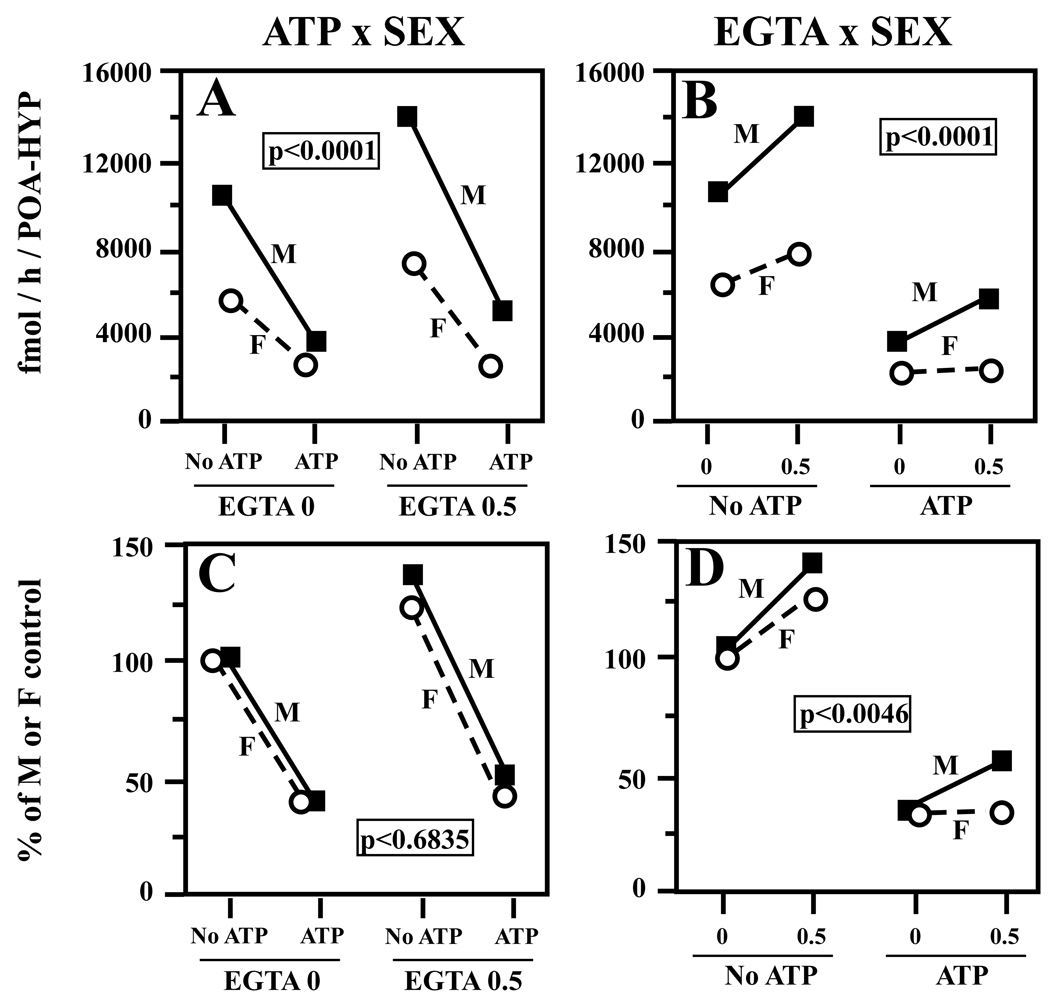
Figure 4.
Graph illustrating the interactions between the sex of the experimental subjects and the effects of ATP/Mg2+/Ca2+ (A, C) or of EGTA (B, D) on brain aromatase activity in the data presented in figure 3. The top two panels (A,B) represent interactions as detected in raw data (in fmol/h/POA-HYP) while the bottom panels (C, D) represent these same interactions with data expressed as percentage of the average sex-typical activity in the absence of EGTA and of ATP/Mg2+/Ca2+. No ATP/ATP = absence/presence of ATP/Mg2+/Ca2+; 0/0.5 = concentrations of EGTA in mM.

