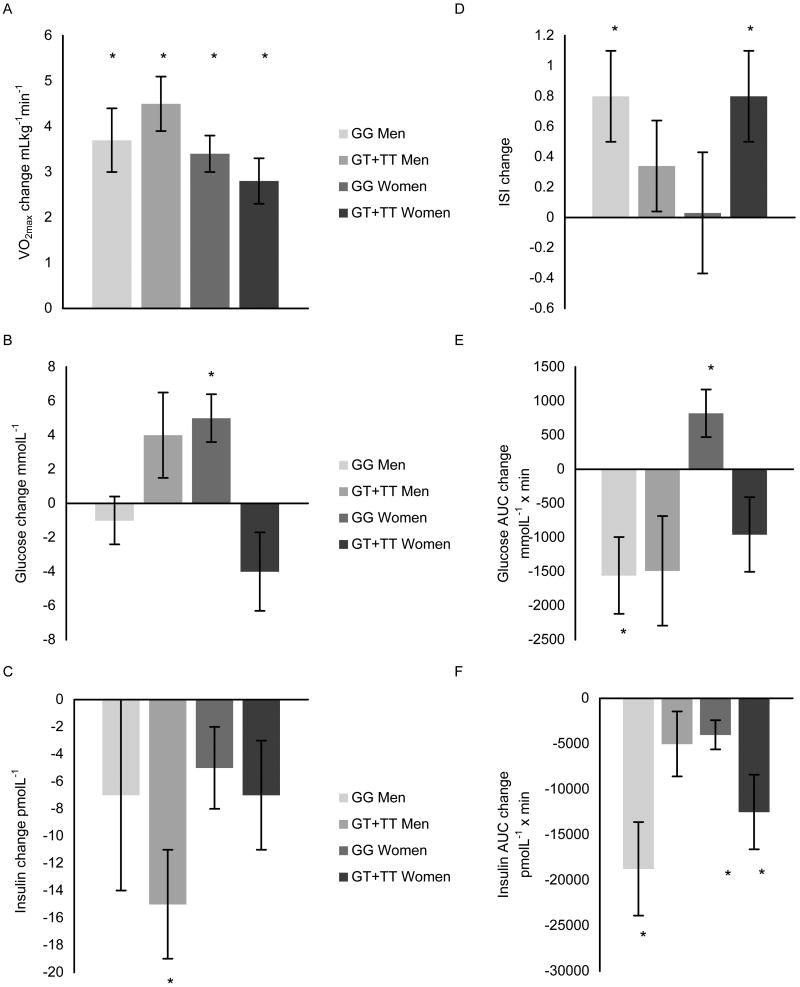
Figure 1. Aerobic exercise training-induced changes in A) VO2max, B) fasting glucose, C) fasting insulin, D) ISI, E) glucose AUC, and F) insulin AUC by AKT1 G205T genotype and gender.
Data are expressed as unadjusted means ± SE. VO2max, maximal oxygen consumption; ISI, insulin sensitivity index; AUC, total area under the curve. * indicates significant difference within genotype group with training p ≤ 0.05.

