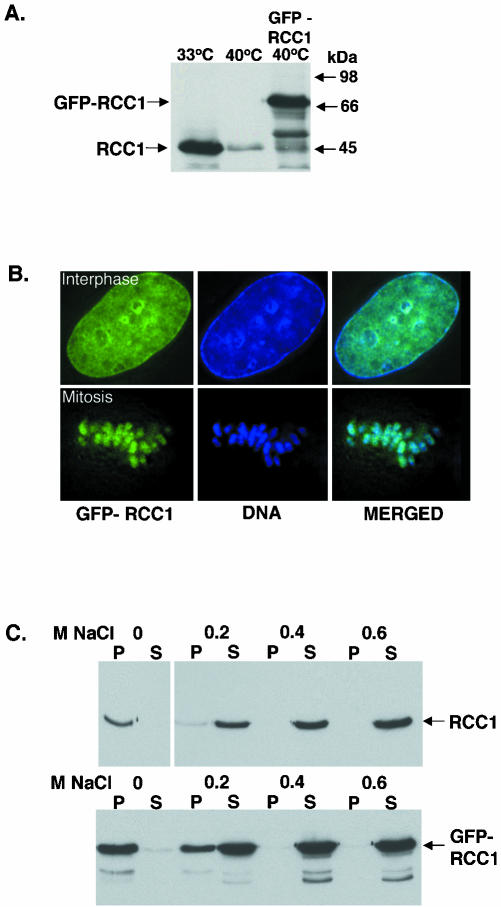
Figure 1.
Comparison of GFP-RCC1 with endogenous RCC1. (A) Anti-RCC1 immunoblot showing the expression levels of RCC1 and GFP-RCC1. Left lane, tsBN2 cells grown at permissive temperature (33°C). Middle lane, tsBN2 cells after being shifted to nonpermissive temperature (40°C) for 15 h. Right lane, GFP-RCC1 tsBN2 cells grown at 40°C. The same amount of cells is loaded on each lane. (B) GFP-RCC1 colocalizes with chromatin throughout the cells cycle. Left panel, GFP-RCC1 in a living cell. Middle panel, DNA stained with Hoescht stain in the same cell. Right panel, overlay of these two images. The top row shows an interphase cell, whereas the bottom row shows a cell in metaphase (C) RCC1 and GFP-RCC1 require the same salt concentration for elution from chromatin. Top gel, extraction of RCC1 from tsBN2 cells (grown at 33°C) with increasing concentrations of NaCl. Bottom gel, GFP-RCC1 is extracted from GFP-RCC1 cells (grown at 40°C) the same concentration of NaCl. After salt incubation, the samples were separated into supernatants (S) and pellets (P) and both were blotted with an anti-RCC1 antibody.

