Figure 4.
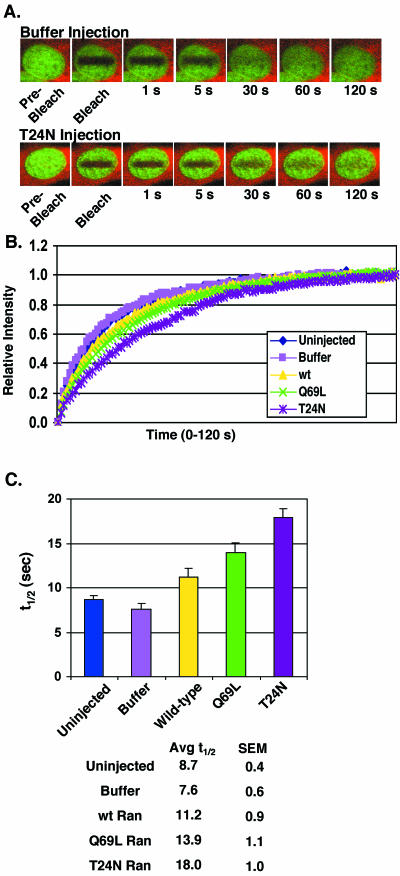
Excess Ran slows GFP-RCC1 recovery after photobleaching. (A) GFP-RCC1 cells microinjected with injection buffer (top) or the mutant T24N Ran (bottom) before photobleaching and measurement of fluorescence recovery. The red fluorescence is the Texas Red 70-kDa dextran coinjected with buffer or unlabeled Ran in the cytoplasm to mark the injection site. The green fluorescence is GFP-RCC1. (B) Recovery of fluorescence after photobleaching for GFP-RCC1 interphase cells either uninjected (blue diamonds), microinjected with marker alone in injection buffer (pink squares), or marker plus wt Ran (yellow triangles), Q69L Ran (green Xs), or T24N Ran (purple asterisks). After photobleaching, the fluorescence was measured every second for 120 s. (C) The t1/2 of recovery for each condition calculated from the data points shown in B. n = 15 for each condition and the SEs are shown (SEM). The times of recovery of interphase cells injected with wt Ran, Q69L Ran, and T24N Ran were significantly different from cells injected with buffer alone (p<.05). The recovery time for T24N Ran was significantly different from that for wt Ran (p<.001), however the recovery time for Q69L Ran was not significantly different from wt Ran (p=0.076). In these experiments 5 microinjected cells from 3 separate coverslips (total of 15 cells for each condition) were blindly selected for FRAP analysis. The analyzed recovery period was extended to 2 min (compared with 1 min in the experiments shown in Figure 2) to allow complete recovery of all cells.

