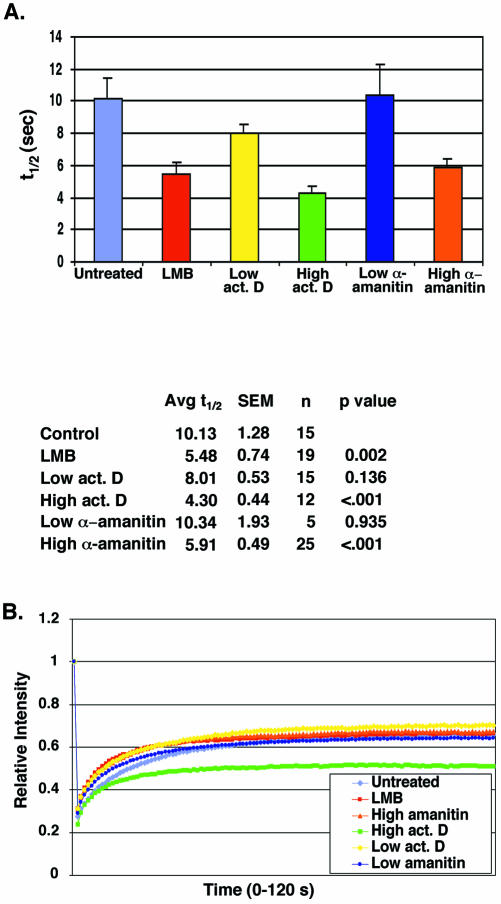
Figure 5.
Agents that disrupt various Ran-dependent export pathways also alter the mobility of GFP-RCC1. GFP-RCC1 tsBN2 cells were pretreated for 5 h (at 40°C) with the indicated agent before photobleaching. (A) Measurement of the t1/2 required for recovery of fluorescence after photobleaching after the various treatments. Cells were incubated for 5 h at 40°C before FRAP analysis with either LMB (50 ng/ml), low actinomycin D (0.02 μg/ml), high actinomycin D (3.2 μg/ml), low α-amanitin (50 μg/ml), or high α-amanitin (300 μg/ml). (B) The extent of recovery after photobleaching after no treatment (purple diamonds), LMB (red squares), high α-amanitin (orange triangles), high actinomycin D (green squares), low actinomycin D (yellow diamonds), and low α-amanitin (blue circles). The cells treated with high actinomycin D did not recover to the same level as the others, indicating the likely presence of a second, more immobile population of GFP-RCC1. In Figures 2B and 4B, 1.0 on the y-axis of the recovery graphs represents the final recovery achieved after photobleaching. In Figure 5B, 1.0 on the y-axis represents the initial fluorescence before photobleaching.

