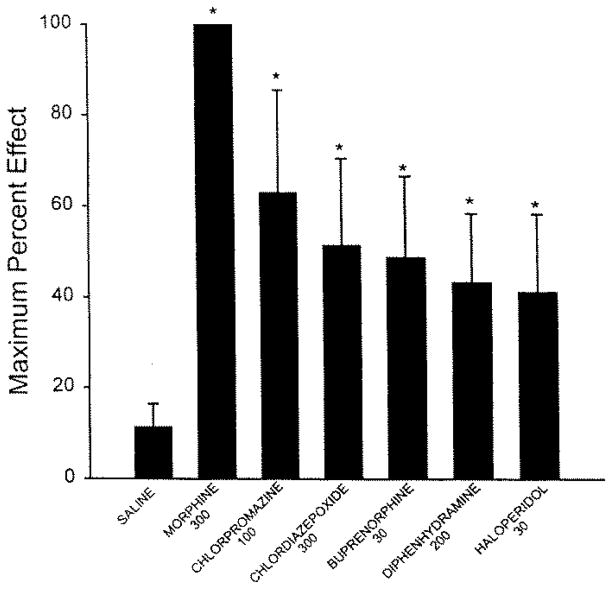
Figure 3.
Mean peak analgesic effect [Is rewording accurate?] of morphine, chlorpromazine, chlordiazepoxide, and buprenorphine, diphenhydramine, and buprenorphine after systemic administration in amphibians (n = 4 to 6 per group). Saline-injected control group is included for comparison. *, P< 0.05 (Student’s t test) versus saline control group. [Please add “nmol/g” to doses given on s-axis of figure. Please “define” bars—1 standard deviation?]

