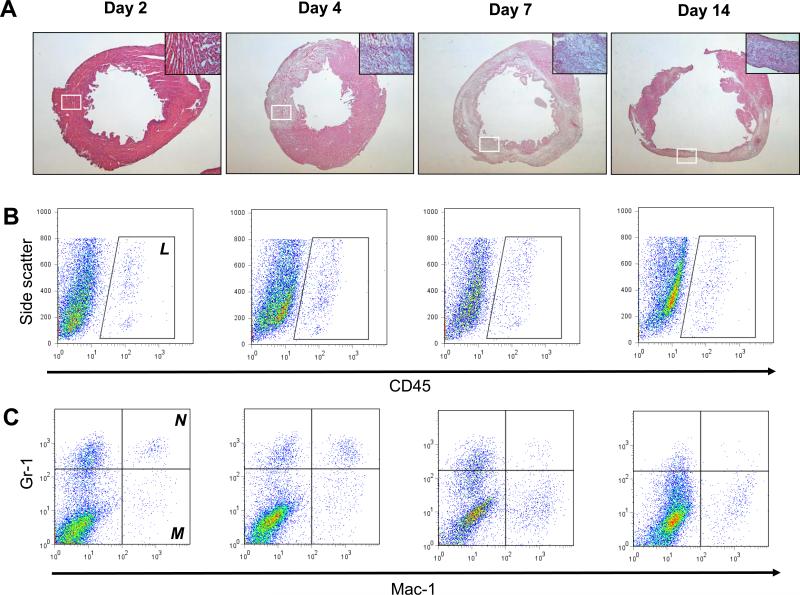
Figure 1. Quantification of myocardial inflammation following LAD ligation in FVB mice.
(a) H&E staining performed on sections of the left ventricle at different time-points following LAD ligation shows increasing infiltration of mononuclear cells over time leading to ventricular remodeling (Magnification: 16x). Higher magnification images (200x) taken from the area within the white boxes are shown in the upper right corner of each image. (b) Corresponding panels of flow cytometric analysis show that intramyocardial infiltration of CD45+ leukocytes reaches a maximum at 4 to 7 days following LAD ligation. (c) More specifically, infiltration of Mac-1+Gr-1high neutrophils (N) peaks on day 4, whereas Mac-1+Gr-1low macrophages (M) peak on day 7 following LAD ligation. (d) Graphical representation of infiltration of inflammatory cell subsets. (Error bars indicate standard error of the mean (SEM))


