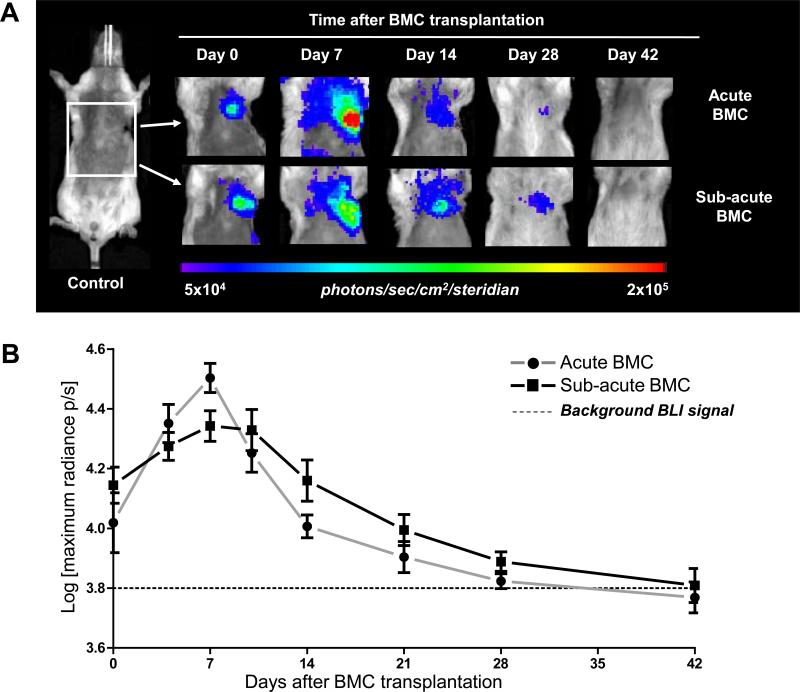
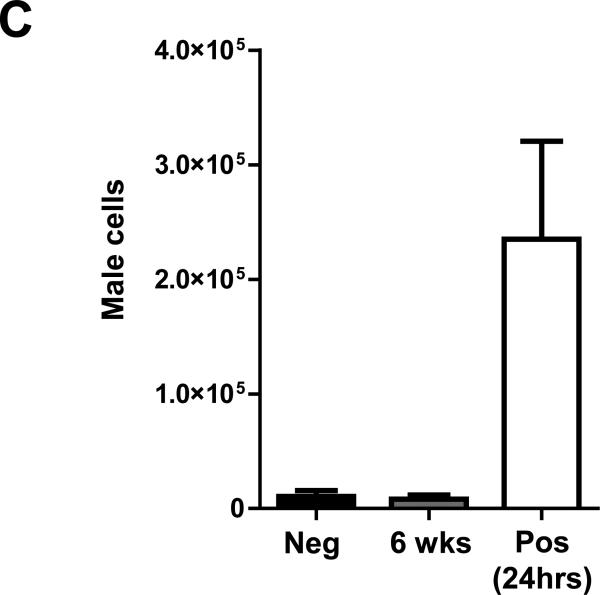
Figure 3. Longitudinal in vivo tracking of transplanted BMCs.
(a) Representative BLI images of BMC transplanted animals either acutely (Acute BMC, upper panels) or 7 days after MI (Sub-acute BMC, lower panels) show proliferation of the cells early after transplantation. Thereafter, in both groups the BLI signal decreases gradually over time to reach background levels at day 42. Color scale bar values are in photons/s/cm2/sr. (b) Graphical representation of longitudinal BLI shows increased signal intensity in both BMC groups at day 7, followed by a non-significant trend towards improved BMC survival in the Sub-acute BMC that persisted until BLI signal reached background levels at day 42 day. (c) Ex vivo quantitative TaqMan PCR detected similar levels of BMCs when comparing negative control (Neg) and 6-week BMC-injected heartsIn contrast, drastically more male BMCs were found in the 2 hour positive control (Pos) hearts (n=3 per group). (Error bars indicate SEM).


