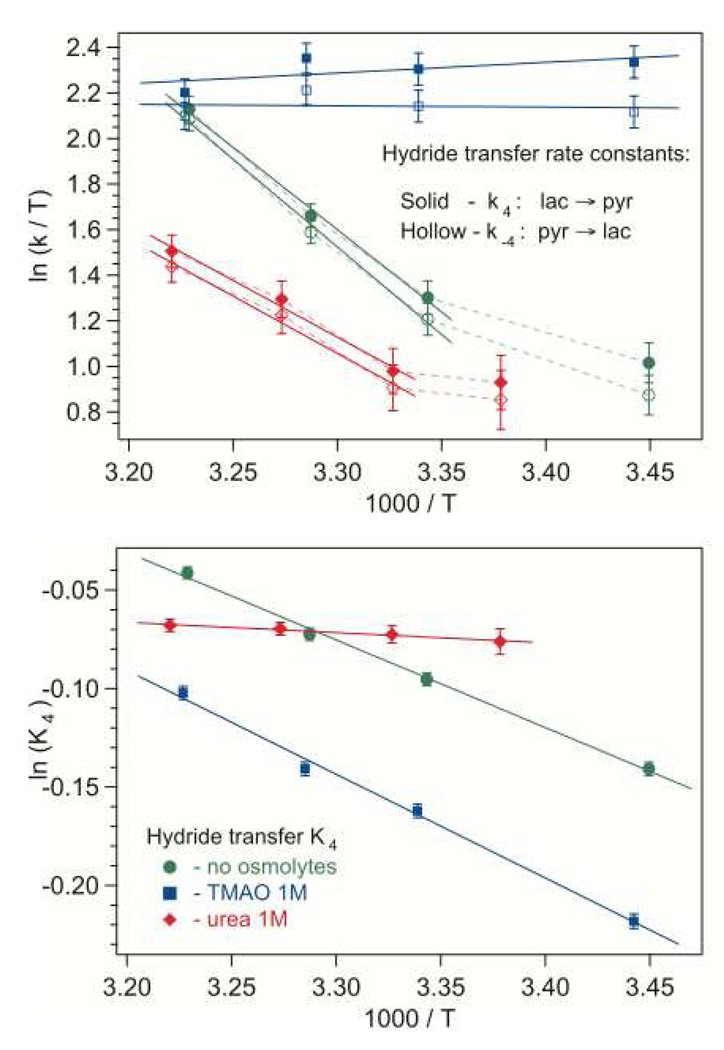
Figure 4.
Hydride transfer rate constants in Eyring coordinates (upper graph) and equilibrium constant in Arrhenius coordinates (lower graph): without osmolytes, with 1 M TMAO, and with 1 M urea. On the upper graph, solid symbols correspond to the forward reaction (from lactate to pyruvate), and hollow symbols represent the back reaction. Solid lines are linear fits. The error bars represent average parameter variances in near-successful iterations resulting in simulated kinetics with their difference close to the noise level.

