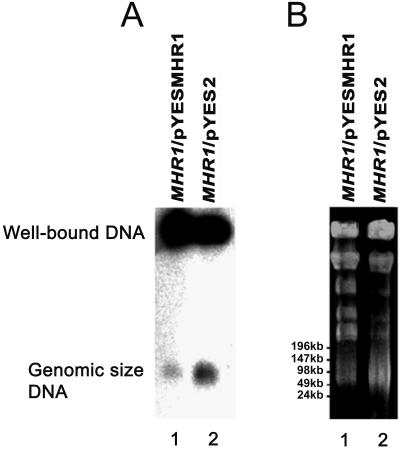
Figure 4.
PFGE profiles of ρ+ mtDNA in MHR1 cells that overproduce Mhr1p. The MHR1 cells (W303a/pYES2) with only the vector pYES2, and the MHR1 cells (W303a/pYESMHR1) with the plasmid DNA bearing MHR1 inserted under the control of the GAL promoter (pYESMHR1) were cultured in galactose-containing medium (YPGal) at 30°C to mid-logarithmic phase (from 1 × 10⁵ to ∼5 × 10⁶ cells/ml). Then, the preparation of the total cellular DNA for PFGE and the PFGE were performed, as described in Ling and Shibata (2002). (A) The detection of signals from mtDNA, by using 32P-labeled purified r+ mtDNA as a probe. (B) The detection of DNA under UV-light after ethidium bromide staining. λ ladder DNA (concatemers) and λ DNA digested with HindIII were used as size markers. Note that the relative intensities of the genomic size mtDNA (∼80 kbp) to the well-bound DNA were weaker in the Mhr1p-overproducing cells compared with the normal MHR1 cells.

